• Skip to primary navigation
  • Skip to main content
  • Skip to primary sidebar

Syngenta Thrive

  • Home
  • Articles
    • Field Insights
    • Tech & Research
    • Community & Culture
    • Farm Operations
    • Archived Issues
  • Videos
  • Sign Up
  • About Us

December 9, 2022 by McKenna Greco

It’s no secret that farmland values have been on a tear in recent years. Fueled by low interest rates and strong farm profitability, the most frequent question has been, “how much higher?” With many data sources and variations across states and regions, it’s helpful to step back and consider the trends.

The graph below shows the value of U.S. cropland since 2000. Over the 22-year period, values increased from $1,460 to $5,050 per acre. This is equal to an average annual rate of increase of 5.5%.

Over the last year, these values jumped 14.3%. That kind of jump happens periodically when you look across the last 22 years.

Historically, cropland has experienced short periods of big gains, followed by years of smaller changes. This is to say, the average annual gains of 5.5% are rarely observed. Large gains in valuations were posted in 2004 — when values increased by more than 17% — and again between 2011 and 2013 when double-digit annual increases were sustained. Since 2000, values increased by more than 10% annually on seven occasions — or 32% of the time. On the other hand, land values increased by less than 5% annually twelve times — or 55% of observations.

A bar chart showing the difference in U.S. cropland values over the years
Data Source: NSDA NASS.
The average doesn’t tell the story well. U.S. cropland values jumped by double-digits seven times between 2000 and 2022, according to a U.S. Department of Agriculture report released in August. The average gain over that span is 5.5%.

Big Variations Since 2010

The second graph shows the change in cropland values at the state level since 2010. First, keep in mind that a 100% increase means values doubled. Six states — those in the northern Great Plains and western Corn Belt — saw cropland values more than double. The largest gains occurred in North Dakota, up 180%. While one would expect considerable difference with county-level data, the average value of cropland in North Dakota increased from $840 per acre in 2010 to $2,350 in 2022. Large gains in cropland values were also observed throughout the Corn Belt, southern Plains and Delta region. It should be noted, however, that the “farmland boom” story varies across the United States. For example, cropland values in the Southwest, specifically Arizona and New Mexico, increased by less than 10% in total across the two decades. In these states, the total increase is what some states observed on an average, annualized basis.

Similarly, land values in the Southeast also were slow to increase. Why have farmland values increased so slowly in some regions? At a high level, it’s because farm economy expansion hasn’t impacted each commodity or region in the same way. In general, regions that were able to increase the production of profitable commodities, such as corn and soybeans, saw the largest gains in farmland values. A second consideration is regional challenges, such as water availability in the Southwest.

A map chart illustrating the change in cropland values by state from 2010 to 2022
Data Source: USDA NASS and AEI.ag calculations.
State-level changes in cropland values between 2010 to 2022 show values more than doubled in six states in the northern Great Plains and western Corn Belt. Across the country, the largest gains are in regions that were able to increase the production of profitable commodities, such as corn and soybeans.

Wrapping it Up

For many, the farmland boom since late 2020 builds on the gains of the last two decades. National-level data show that farmland posted small, modest increases in most years. However, there are a handful of years when large annual increases — greater than 10% — occur. The most recent data reveal the changes since 2021 are among those large gains.

Second, conditions vary significantly by region and state. Gains in the northern Great Plains were huge, while changes in the Southeast and Southwest were considerably less. Producers need to keep this in mind when sizing up how much local conditions have changed.

Lastly, news of higher farmland values is often met with excitement. This is because farmland accounts for a majority — around 80% — of the farm sector assets. In other words, a majority of farm assets are farmland. Additionally, farmland values tend to increase during times of strong profitability. However, it’s worth keeping in mind that higher farmland values are also reflective of higher costs of production through higher cash rents paid. It can also mean higher debt service obligations and lower rates of return for those looking to purchase new acreage.

While the farmland story has been largely positive in recent memory, the outlook will be dominated by uncertainty around rising costs of production, future commodity prices, and interest rates. At this point, a wide range of outcomes seems possible.

David and Brent are the co-founders of Ag Economic Insights (AEI.ag). Founded in 2014, AEI.ag helps improve producers, lenders, and agribusiness decision-making through 1) the free Weekly Insights blog, 2) the award-winning AEI.ag Presents podcast – featuring Escaping 1980 and Corn Saves America, and 3) the AEI Premium platform, which includes the Ag Forecast Network decision tool. Visit AEI.ag or email David (david@aei.ag) to learn more. Stay curious.

December 1, 2022 by McKenna Greco

“Crop scouting is hot and sweaty,” says Guy Collins, Ph.D., extension cotton specialist for North Carolina State University (NCSU). “You’re going to pull some very long hours, but it’s one of the greatest jobs I’ve ever had.”

Many who scout crops share this sentiment. Perhaps that’s because of the education scouting provides in selection pressure and pest management technologies, and also in accountability. “Scouting teaches you responsibility because you’ve got someone’s livelihood at stake based on your job performance,” Collins says.

What’s the Point?

Crop scouting is monitoring for anything that helps farmers manage crops more profitably and sustainably. Examples include looking for fertility issues, collecting plant measurements and checking for pests.

J.R. Bradley, Ph.D., professor emeritus at NCSU, suggests that scouting is closely tied to pesticide development because there is no need to scout if what’s found can’t be managed.

Scouting and integrated pest management strategies are intertwined. “Scouting to threshold” means monitoring pests and managing them when doing so is cheaper than letting them continue reducing yields. This leads to better on-farm economic outcomes for farmers, as well as more sustainable agronomic practices.

Scouting is dynamic: Pests, practices and prices change. North Carolina cotton fields provide a clear lesson on how scouting must evolve as pest resistance increases, emerging pests challenge historical management programs, and new crop protection technologies create ripples across the pest spectrum.

''

We’re blessed with tools that help us get the insights we need more quickly. That efficiency hopefully creates more time for our families and personal lives.

Joe Ben Bogle Digital Ag Solutions Marketing Lead at Syngenta

One Principle, Many Crops

The boll weevil nearly destroyed the cotton industry in North Carolina. The pest was so destructive that cotton farmers made programmatic insecticide applications that required little scouting. In the 1980s, the boll weevil was eradicated thanks to researchers like Bradley and farmers like Marshall Grant, who was instrumental in getting The Boll Weevil Eradication Program established in North Carolina.

Once the frequent insecticide applications for boll weevil stopped, tobacco budworms and bollworms became the major cotton pests, and scouting to properly time insecticide applications for the worms became more important.

Years later, when farmers began planting Bt (Bacillus thuringiensis) cotton, which produces proteins that are toxic to bollworm and tobacco budworm larvae, insecticide applications again declined and stink bugs and plant bugs became the new problem pests. “As more fields were planted with Bt cotton,” Collins says, “The way we managed bollworms changed and other pests became more of a problem.”

Such changes demanded new scouting techniques, both to detect the economically damaging pests and reset bollworm thresholds. Those techniques include checking different parts of a plant, as well as using various tools to gather data.

Those cotton lessons also apply in other crops, says Nick Groenenberg, independent pest control advisor and owner of Nick Groenenberg Agricultural Consulting. He scouts tomatoes, almonds, pistachios and cotton in California. “When pistachios were first introduced,” Groenenberg says, “We were told they had no pests, but through the years they’ve developed several. We’d never had a problem with aphids in cotton and 15 years after I started in the business, they became a problem. We just keep adjusting.”

It’s a Drone, It’s a Plane, It’s a Satellite

Luckily, as pests evolve so does scouting technology.

Joe Ben Bogle, digital ag solutions marketing lead for Syngenta, helps streamline monitoring strategies with digital ag platforms like Cropwise™ Imagery and Cropwise Protector. “We’re blessed with tools that help us get the insights we need more quickly,” Bogle says, “That efficiency hopefully creates more time for our families and personal lives.”

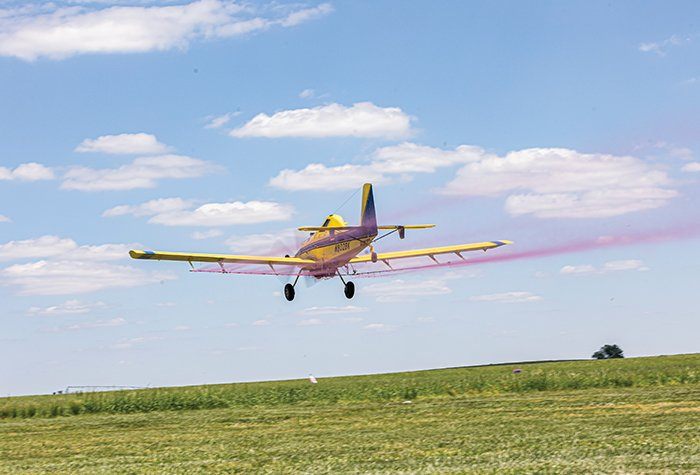
Bogle believes digital ag tools deliver value through offering efficiency and insight scouts can take into the field. Aerial imagery is one useful option. “Today we have access to satellite, airplane and drone imagery,” Bogle says. “They all have their pluses and minuses.”

Scouts essentially have three ways to gather aerial imagery:

  • Satellite imagery, the most scalable and autonomous, can collect data daily. But it doesn’t offer the best resolution and can’t always take photos at the most opportune time of day.
  • Airplane imagery provides higher resolution, but at higher cost with lower collection frequency.
  • Drones, the most adaptable, can gather high-altitude images for a picture of overall field health and perform near canopy-level flights for greater detail. But to use drones, the scout or farmer must invest time and money in meeting regulatory requirements and either buying equipment or contracting for the service.

By whichever path, aerial imagery provides information about which areas of the field are under stress and which are high-performing. That knowledge can inform scouting strategies such as where to enter fields and prioritize sampling — saving a few steps that quickly become miles in the hot summer sun.

Harvesting Data

Bogle believes digital ag systems are successful when they turn data into something actionable.

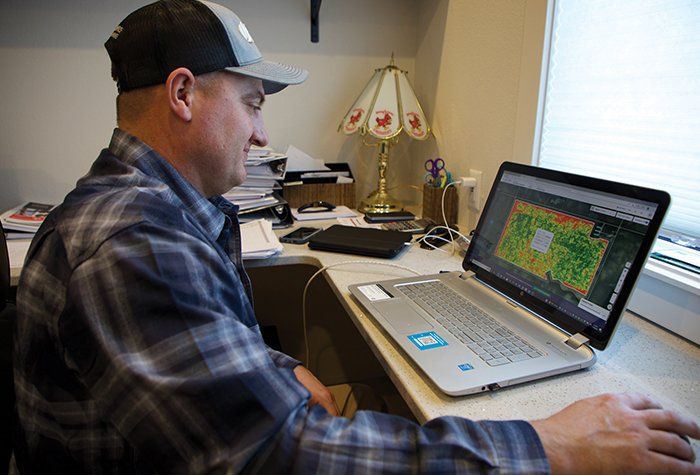
For example, Cropwise Imagery automatically reviews satellite images of fields and identifies whether field health is rising or falling. “If somebody has a couple hundred fields to look after,” Bogle says, “Showing which five are most at risk helps them prioritize.”

Cropwise Protector accounts for geography, crop and scouting preference. For instance, the program averages individual sweep net collections to field level and then color codes fields that have active issues and those below threshold. Cropwise Protector also includes a timeline for all past scouting events, effectively acting as a digital filing cabinet.

However, nothing replaces walking the fields.

“I think there will always be boots on the ground,” Groenenberg says, “But the more informed scouts are then the better job we can do.”

Bogle agrees.

“We’re looking to integrate more predictive models and help remind those in the field what might be a factor, not replace boots on the ground,” he says.

MOST POPULAR ARTICLES

Active Ingredient Spotlight: ADEPIDYN Technology

Advancing Regenerative Agriculture

Stay Healthy Inside and Out: Wellness Tips for Farmers

Protect Groves From Citrus Leafminer: Where to Start

Navigating Volatile Markets With Confidence

December 1, 2022 by McKenna Greco

In the next year, we will read and hear a lot more about the Farm Bill. Once passed, the legislation will impact how we raise food, fuel and fiber — and how much risk is involved in those enterprises.

While its name suggests it’s all about farmers, the expansive Farm Bill governs policy that includes farm income support, food assistance, conservation programs, trade and more. Its three main pillars are:While its name suggests it’s all about farmers, the expansive Farm Bill governs policy that includes farm income support, food assistance, conservation programs, trade and more. Its three main pillars are:

  • To help farmers survive the ups and downs of a risky business.
  • To feed the hungry.
  • To protect the environment.

The bill must be renewed on a regular basis — usually every five years — and is on the docket in 2023.

A Rich History

The first Farm Bill was created in 1933 as part of the New Deal. It provided subsidies to farmers during the Great Depression by paying them to stop producing seven main crops in the hopes of decreasing supply, and thus increasing prices, of those crops. The bill also contained provisions related to conservation and support for farmers suffering from the effects of the Dust Bowl.

While the core elements of early farm bills were farm support and conservation programs, a major change occurred in 1973 when Congress added food assistance programs. That change was authored by well-known senators Bob Dole (R-KS) and George McGovern (D-S.D.) — both from big ag states and both prominent supporters of anti-hunger programs.

The senators married these programs because they needed a way to sway urban lawmakers to support a bill that historically benefited rural America. In turn, expanding the Farm Bill encouraged rural lawmakers to support anti-hunger programs that were, at that time, used mostly by the urban poor like the Supplemental Nutrition Assistance Program (SNAP), also known as food stamps.

Nutrition programs, the largest of which is SNAP, comprise 84% of all mandatory spending in the Farm Bill today. The other biggest spending areas are crop insurance (6%), commodity programs (5%) and conservation programs (4%). The remaining 1% includes trade, rural development, research, forestry, energy, livestock and horticulture/organic agriculture.

The projected price tag for the next Farm Bill is $1.3 trillion over 10 years, a substantial increase over 2018’s projected cost of $860 billion over 10 years. If that comes to pass, it will mark the first time in history that a Farm Bill exceeded $1 trillion.

Today’s Priorities

Components of the Farm Bill change every time the bill is re-written, but usually in an evolutionary way rather than a revolutionary one. Today, the commodity programs provide specific forms of income assistance, without interfering with the market, and are compatible with our free trade goals and obligations under the World Trade Organization. Crops covered include corn, soybeans, wheat, cotton and rice; dairy, peanut and sugar producers also have programs.

The primary ag risk management focus is taxpayer-subsidized crop insurance, a tool that farmers in all 50 states can use to cover up to 120 crops in the case of weather and financial disasters. Meanwhile, SNAP helps 41 million low-income Americans afford groceries, and the Women, Infant and Children’s program and school breakfast and lunch programs assist many more.

While the bill still funds conservation programs for land retirement programs like the Conservation Reserve Program, it gives much more emphasis on working lands programs designed to help protect the environment.

It’s much too early to know the outcome of the 2023 Farm Bill, but we do know some things that will affect those decisions:

  1. The midterm election in November 2022 could change party control in both chambers of Congress. With current polling suggesting Republicans will likely win back the House and possibly the Senate, control of the chambers’ agricultural committees could change. A shift in power could mean a major adjustment in what the bill funds, such as agriculture versus nutrition or sustainability policy. Geography will also play a role, with members of Congress from different regions of the country prioritizing different farm policies due to the key commodities in their respective states or districts.
  2. Most farm groups are already lobbying for more funding for the next Farm Bill’s safety net, arguing that the support prices are far too low given current high commodity prices. That funding won’t be easy to attain, but it’s not impossible. The overall funding amount in the new bill will largely determine if this one is evolutionary or revolutionary.
  3. Expect efforts to increase conservation funding to address sustainability and climate change. It will be important that any new conservation or sustainability programs are voluntary for farmers and equitable across regions and crops. It’s also key that farmers who already employ these practices are rewarded for early adoption and not left out of new programs.

The Farm Bill has considerable ramifications for farmer livelihoods, national food security and the environment. It’s been said that “if you aren’t at the table, you are on the menu.” Farmers and ranchers who are hungry for adequate risk management programs and environmental legislation that doesn’t limit on-farm economic sustainability need to be at the table.

MOST POPULAR ARTICLES

Active Ingredient Spotlight: ADEPIDYN Technology

Advancing Regenerative Agriculture

Stay Healthy Inside and Out: Wellness Tips for Farmers

Protect Groves From Citrus Leafminer: Where to Start

Navigating Volatile Markets With Confidence

November 18, 2022 by McKenna Greco

Farmers have always been dedicated stewards of the land and invested in the sustainability of their operations, but they haven’t always successfully shared these stories with the public.

In an increasingly digital world, consumers expect increased access to and transparency from companies. It’s no different when it comes to the food they purchase. People are more eager than ever to understand the ingredients in their food, how those ingredients were cultivated, and the environmental impact of it all.

The consumer’s quest for knowledge seeps through the agriculture supply chain, trickling all the way down to the growers whose crops are processed into grocery store offerings. How can the agriculture industry understand and share its sustainability story? Data, both quantitative and qualitative, plays an important role.

All About the Data

Agricultural sustainability encompasses environmental, financial and social sustainability. No matter which facet is examined, Jeff Lail, senior data analyst at Syngenta, says understanding sustainability at the farm level begins with gathering data points to set a baseline and support future tracking efforts.

“Data tracking on farm is similar to maintaining a household budget,” Lail says. “It’s easier to save money when you’re keeping track of what you’re spending. Similarly, having a good understanding of where your farm resources go will help you manage those resources better.”

Daniel Olson, a sugarbeet, pinto bean and wheat farmer from North Dakota, agrees that taking stock of your current sustainability efforts is important.

“You have to take inventory of where you’re at to establish if you’re headed in a positive or negative direction,” Olson says. “This baseline will also help you determine down the road if the practices you think are helping you actually are.”

While setting a baseline is a crucial first step in calculating sustainability, Lail says the real benefit is in the change that comes from that measurement. To help growers achieve both measurement and change, Syngenta created the Cropwise™ Sustainability app.

One Size Doesn’t Fit All

The Cropwise Sustainability app experience begins with a quick self-assessment called the Sustainable Outcomes in Agriculture (SOA) standard that gathers qualitative and quantitative information in six key areas: crop production, water impact, soil health, biodiversity and habitat, human and animal well-being, and community leadership. After completing the assessment, an intuitive digital dashboard populates with sustainability scores in each area, recommendations for improvement, and the opportunity to see how scores compare to other app users in a specified geography.

“The process of measuring and tracking sustainability followed by figuring out what to do with that data has been a real pain point for growers,” Lail says. “With the Cropwise Sustainability app, we tried to lower that difficulty level by identifying where a grower can improve the most and offering recommendations that don’t require overhauling farm operations.”

Olson, who completed the SOA standard, appreciated the diversity of sustainability practices considered by the assessment in addition to the geographical insights.

“There is no ‘one size fits all’ approach to sustainability,” Olson says. “How I manage sustainability in North Dakota will be very different from someone in another geography.”

As helpful as this app is at the farm level, its impact extends deep into the agriculture supply chain.

A grower and rep look at a laptop and discuss sustainability solutions

Building Bridges Between Growers and Consumers

Trent Wimmer, key account sustainable solutions lead at Syngenta, helps growers and other agriculture industry partners tell their sustainability story with tools such as the Cropwise Sustainability app.

“Let’s say you’re a consumer packaged goods company, and you’re trying to understand your greenhouse gas footprint and communicate it to end-consumers,” Wimmer says. “You can only manage what you have in front of you, which is

the manufacturing of the products — you don’t have direct access to what went into the ingredients that you’re processing. That’s where Syngenta can help connect the dots between manufacturers and growers.”

For instance, Syngenta partnered with United Sugars, a sugar supplier, to help bridge the gap between growers and consumer packaged goods companies by implementing the SOA standard self-assessment with a group of sugarbeet farmers, including Olson, in Minnesota’s Red River Valley.

The assessment was mutually beneficial. Growers received sustainability insights and actionable recommendations as a result of the SOA standard, and United Sugars provided the anonymized data to their customers to help complete the sustainability picture for the foods they produce.

According to Wimmer, Cropwise allows Syngenta to “collect meaningful data from growers and in turn provide valuable sustainability insights.”

“Partners like United Sugars can take the data from the SOA standard and tell a much more unique sustainability story to their own customers,” he says.

Growers also benefit from these sustainability tools. “Syngenta is a grower-centric company that is also committed to regenerative agriculture,” Wimmer adds. “Helping growers understand and share their sustainability story is a way that we add value to growers beyond just yield.”

Donna Isakson, sales and marketing manager at United Sugars, values the partnership with Syngenta and the leadership they’ve provided in calculating sustainability efforts.

“The goal of our partnership with Syngenta is to be more transparent with our customers and show them what United Sugars is doing from a sustainability perspective,” Isakson says. “Syngenta has been so helpful in navigating this as they have expertise in both working with growers and in ag technology and data.”

November 16, 2022 by Jeff Bond

“Unique.” “Educational.” “Relevant.” These are some of the most common words visitors have used to describe Grow More™ Experience sites in recent follow-up surveys. Since 2013, Syngenta has designed the sites to showcase its crop-protection and seed technologies, including NK® corn and soybeans. The sites also provide opportunities for attendees to engage in conversations about local agronomic practices that can help improve crop productivity. This year, Syngenta will continue the momentum by highlighting innovative solutions and practical advice that site visitors can use to secure a more promising future for their farms and businesses.

Local Point of View

With more than 80 locations across the U.S., Syngenta strategically selects Grow More Experience sites in areas based on geographically specific crops, weather, climate and pest patterns.

“We know each customer has a different in-season experience,” says Mike Moss, Ph.D., head of technical development at Syngenta. “Instead of offering one-size-fits-all solutions, our agronomic experts are there to listen and provide the best localized options for our customers.”

The sites’ purpose is to educate visitors on what they can do to continue to help mitigate pest issues and reach maximum yield. This process involves site leads discussing and comparing the top products in the industry, including competitors’.

“I was amazed by the fungicide trials, which compared almost everything on the market,” says Mike Feig, a crop consultant from Illinois, who visited the Grow More Experience site in Rend Lake, Illinois. “When a company normally does something like this, it’s biased. But at Grow More Experience sites, you can see the difference for yourself.”

November 1, 2022 by McKenna Greco

It’s easy to get caught up in the latest World Agricultural Supply and Demand Estimates — and subsequent market response — but looking at the bigger picture is often more valuable. Many have noted that ending stocks are tight for several commodities. However, let’s look at just how tight conditions are across all commodities, and how that stacks up with historical observations.

The Data

Our team, the AEI team, has a unique way of considering the ending stock situation across all 13 primary crops. To measure overall abundance or tightness, we convert the quantity of ending stocks (i.e., bushels) for each crop to acres worth of production. For example, instead of thinking about U.S. corn stocks as 1.388 billion bushels worth, we use a measure of yield to calculate acres worth of ending stocks. This acre-equivalent measure has the benefit of being consistent across all commodities and, subsequently, ending stocks can be added together.

This broad measure provides insights such as how easily a tight corn situation might be resolved. If global stocks are abundant in other crops, such as soybean or wheat, acreage could be shifted to increase corn production. However, if ending stocks are tight across all crops, substituting soybean for corn isn’t as feasible. This is to say that new acres can sometimes be hard to steal from other crops and, in extreme circumstances, may require new acreage to come into production.

The U.S. Situation

Figure 1 shows the acre-equivalence of ending stocks across 13 crops. For 2021, ending stocks were tight, at nearly 33 million acres worth. For 2022, the situation is even tighter as current projections put ending stocks at nearly 30 million acres worth. For context, stocks reached nearly 60 million acres as the trade war got underway in 2018. Ending stocks across all crops harvested in 2022 are projected at half the levels seen just four years ago.

Historically, acre-equivalent ending stocks were as low as 28.7 million acres in 2013 and 25.4 million acres in 1995. While a bit off the record lows, the current U.S. stock situation is among the tightest observed since the 1970s, and conditions have spanned both extremes in a short period of time.

A line chart shows the number of acres of crop ending stocks for the 13 primary crops in the U.S.
Figure 1: U.S. crop ending stocks, on an acre-equivalent basis, have tightened in recent years. Data Source: USDA’s PDS database and AEI.ag calculations.

The World Situation

This method of measuring stocks also allows us to capture how tight — or abundant — grain inventories are at the global level. There are two challenges, however. First, China accounts for a large share of global grain inventories. To account for this, we can remove China’s quantity of ending stocks from the global total. The logic here is that China is a net importer of grains, so these bushels are unlikely to be exported. These adjusted data provide a measure of how much is available for global trade.

How big of a deal is this? In 2022, China accounted for roughly half of the acre-equivalent global ending stocks.

The second issue is that the global factory has expanded over time, and the 300 million acre-equivalence of ending stocks in 2022 is less burdensome today than it was 10 to 20 years ago.

Figure 2 reports global ending stocks, less China’s inventory, as an acre-equivalent share of harvested acres. This measure reports ending stocks available for trade relative to the size of the global acreage factory.

In 2022, global ending stocks are equivalent to 12.8% of global production, down from 13.3% in 2021 and a high of 14.7% in 2018. This measure of stocks shows conditions are considerably tighter than the 2013 lows (13.3%). Given all the factors, ending stocks across the board are arguably the tightest in two decades.

A line chart shows global ending stocks, demonstrated by the acre-equivalent basis as a share of harvested acres
Figure 2: Global ending stocks, demonstrated by the acre-equivalent basis as a share of harvested acres, show conditions are considerably tighter than the 2013 lows. Data Source: USDA’s PDS database and AEI.ag calculations.

Wrapping It Up

The grain end-stock situation trended tighter in recent years. While conditions in 2021 were tight, it seems they will be even tighter after the books are closed on 2022.

There are two key reasons monitoring these data is important. First, it provides us with background on how nervous markets will be about supply-related issues, such as weather, conflict or economic sanctions. Given the overall tight global situation, any hiccup could have significant implications.

Second, each commodity has its own story and degree of uncertainty, but the big picture consideration is that conditions across the board are tight. The implications are that any supply shocks won’t easily be solved with substitution acres. Instead, growers would need to bring new crop acres into production around the world to make up a shortfall.

Concerns about tight stocks will likely continue into 2023. The combination of usage, acreage and yields will ultimately determine when ending stocks turn higher, but we expect this to take place at some point.

Widmar and Gloy are the co-founders of Ag Economic Insights (AEI.ag). Founded in 2014, AEI.ag helps improve decision making for producers, lenders, and agribusiness through: the free Weekly Insights blog, the award-winning AEI.ag Presents podcast- featuring Escaping 1980 and Corn Saves America, and the AEI Premium platform, which includes the Ag Forecast Network decision tool. Visit AEI.ag or email Widmar (david@aei.ag) to learn more. Stay curious.

November 1, 2022 by McKenna Greco

Steve, David and Jeannette come from different backgrounds, live in different regions of the country, and work with different plant varieties as crop protection field development (CPFD) scientists for Syngenta. But they have something in common: nobody understands their job.

To those outside agriculture, CPFD jobs are even more of a mystery. David Black, a senior research development scientist, works with crops in Arkansas. Black says friends are often surprised to learn that plants get diseases and that a Ph.D. in weed science is a real thing.

However, CPFD scientists are a crucial link between the development of Syngenta products and getting them on the market, running trials to see whether active ingredients that look promising in the lab will work in the field. It’s a big job, and there’s plenty to do every season — or year-round in Jeannette Rapicavoli’s territory, Southern California and Arizona.

''

The chemists narrow active ingredients down by looking at the products in greenhouses and growth chambers, but that’s not the real world. We’re the first step in looking at products in a living biological environment — soils, direct sunlight, rainfall.

David Black Senior Research and Development Scientist at Syngenta

“In the desert, it doesn’t rain much, and it certainly doesn’t snow or get very cold, so there are always crops going into the ground,” says Rapicavoli, CPFD research and development scientist. “It keeps us very busy out here.”

In the Midwest, if CPFD scientists aren’t planting, they’re planning. Early in the year Mroczkiewicz, who primarily works with corn and soybeans, is prepping his summer trials, doing the paperwork and stocking up on supplies.

“I’ll have somewhere from 30 to 35 field trials in a typical year, usually in several different locations,” he says. “I initiate those, make all the applications, and spend my very hectic spring and early summer keeping up with them. Weekends really don’t have much meaning for us during that time.”

From there, he’s occupied with establishing trials, and then managing them so he can collect performance data.

From Lab to Land

CPFDs are essential in ensuring prospective agronomic solutions have on-farm viability. Syngenta chemists in Basel, Switzerland, and the United Kingdom screen thousands of active ingredients for their agricultural potential. CPFDs around the globe then test these compounds on crops.

“The chemists narrow active ingredients down by looking at the products in greenhouses and growth chambers, but that’s not the real world,” Black says. “We’re the first step in looking at products in a living biological environment — soils, direct sunlight, rainfall.”

Once the field trials are underway, the chemists and other colleagues often tour the trial plots, in what Mroczkiewicz described as a kind of internal outreach.

For Rapicavoli, the tours are an opportunity to be an ambassador for desert agriculture.

“It’s fun when we have our global colleagues from our headquarters out, because some of them have never been to the desert,” she says. “It’s exciting to show them how much production there is in that environment, and all the different crops and diseases we can work on.”

Being ambassadors for agriculture is something else the scientists have in common. When not in the field, they’re available to schools, community organizations and local projects. Mroczkiewicz, for example, writes a column for his local paper and gives guest lectures to college ag classes and at a high school’s FFA® club. He enjoys talking to non-ag groups, too.

A field development scientist inspects corn seedlings

“I spoke to a Rotary club, and they were one of my most enthusiastic audiences because everything I told them was new information,” he says. “I was able to dispel a lot of myths they’d heard about what exactly a genetically modified organism, or GMO crop is, and they got it directly from somebody who has helped develop GMO crops, versus something they saw on Facebook or CNN.”

Nancy Bell, a high school ag science teacher and FFA advisor, has known Mroczkiewicz for more than 20 years and helps with his research alongside her farmer-husband Devon Bell, who has worked with Mroczkiewicz since 2001.

“Steve has a passion for education,” Nancy Bell says, noting that his support of ag in the community includes providing 20 dozen eggs for her FFA poultry unit every year.

Black, who at one time wanted to be a college professor, also enjoys speaking to university students and offering insight on ag as a career.

“A lot of times students just know they like ag and are curious about jobs,” Black says. “We can provide information on what roles in agriculture really entail.”

Rapicavoli, who lives about four hours from her primary research site in Yuma, Arizona, is becoming a community resource there.

“I’m always out there attending local meetings, connecting with growers and university cooperators,” she says. “It’s important to me that I establish myself as a reliable, knowledgeable point of contact.”

Rapicavoli is in year six of her career, while Mroczkiewicz and Black have done the job for 24 and 27, respectively. While they may feel anonymous sometimes, it’s clear they love their CPFD positions.

“It’s such a privilege to work in this role,” Rapicavoli says. “There are only about 30 of us around the country, and sometimes I think, ‘Wow, I get to be one of these people.’ It’s an honor. And it’s never boring, that’s for sure.”

MOST POPULAR ARTICLES

Active Ingredient Spotlight: ADEPIDYN Technology

Advancing Regenerative Agriculture

Stay Healthy Inside and Out: Wellness Tips for Farmers

Protect Groves From Citrus Leafminer: Where to Start

Navigating Volatile Markets With Confidence

October 9, 2022 by McKenna Greco

When choosing crop protection tools, farmers and applicators know to consider both effectiveness and potential impact on the environment. Protecting pollinators and other wildlife are key stewardship practices. That’s why the BeSure! campaign by the Growing Matters coalition provides simple steps to accomplish these goals while using neonicotinoid products.

Discover best management practices when using neonicotinoid products on crops and urban landscapes at https://growingmatters.org/besure.

MOST POPULAR ARTICLES

Active Ingredient Spotlight: ADEPIDYN Technology

Advancing Regenerative Agriculture

Stay Healthy Inside and Out: Wellness Tips for Farmers

Protect Groves From Citrus Leafminer: Where to Start

Navigating Volatile Markets With Confidence

October 9, 2022 by McKenna Greco

Lower interest rates and longer repayment periods make the annual burden of servicing debt easier. This is an intuitive management concept, and it is exactly what we’ve observed over the last several decades in U.S. agriculture.

To illustrate this concept, the adjacent graph shows the annual payment required to service $1,000 of farm machinery debt. At the extreme, the Farm Machinery Debt Service Index exceeded $1,600 in 1982 and spent the first half of that decade above $1,000. This occurred because of high interest and extremely short repayment terms. In the early 1980s, the interest rates on farm machinery peaked at 17.9% in 1981, and repayment terms were a low of 8.36 months in 1982. Not ideal times to carry significant amounts of debt.

Since 2013, the index has been below $400. This is significant as the Index previously dipped below $400 in 1994 ($387) and in 2011 ($384). In 2020, the annual data reached an all-time low of $287. For 2021, the Index remains historically low at $305 but turned higher due to shorter repayment terms (43.1 months in 2021 versus 46.7 months in 2020).

A line chart showing declining annual debt service for farm machinery
Farm Machinery Debt Service Index, annual. 1977-2021. Data Source: KC Fed and AEI.ag calculations.

Interest Rates Versus Repayment Periods

Between 2020 and 2021, the Index jumped from $287 to $305. Within the underlying data, interest rates fell (4.78% to 4.18%) while repayment periods contracted (46.7 months to 43.1 months). This raised the question: which factor — interest rates or repayment terms — was the driving force behind small annual payments?

In 2000, the Farm Machinery Repayment Index was more than $600. By 2021, however, the index fell by roughly half, to $305. Comparing the terms for those two periods, you’d find that of the roughly $300 decline in the Index, $40 can be attributed to lower interest rates (13%), while $267 (87%) is attributable to longer repayment terms. More specifically, the terms in 2000 were a 9.3% interest rate repaid over 22.4 months, and the terms in 2021 were a 4.18% interest rate repaid over 43.1 months.

Why are repayment terms so important? It’s easy to overlook, but moving from a roughly two-year to a four-year repayment period significantly reduces the annual repayment of principal. The Farm Machinery Index is a bit unique in that the repayment periods have roughly doubled since 2000. While repayment periods have likely extended for other types of farm loans, it seems unlikely that the terms across the sector have doubled for, say, real estate loans.

Wrapping it Up

While much attention in 2022 has focused on rising interest rates, and with good reason, don’t overlook repayment periods. Over the last two decades, farm machinery repayments have nearly doubled, which has also reduced the annual debt service burden.

Low interest rates make extended repayment periods attractive for borrowers. However, higher interest rates may make short repayment periods appealing, given concerns about interest expense. A combination of higher interest rates and a short repayment period would cause the index to jump significantly. In this scenario, a farm with the income to service, say, $50,000 of debt annually would find itself utilizing less debt.

David and Brent are the co-founders of Ag Economic Insights (AEI.ag). Founded in 2014, AEI.ag helps improve producers, lenders, and agribusiness decision-making through 1) the free Weekly Insights blog, 2) the award-winning AEI.ag Presents podcast – featuring Escaping 1980 and Corn Saves America, and 3) the AEI Premium platform, which includes the Ag Forecast Network decision tool. Visit AEI.ag or email David (david@aei.ag) to learn more. Stay curious.


October 1, 2022 by Kristin Boza

  • HI-Edit™ technology quickly introduces genetic changes in crop varieties.
  • The goal is to deliver better seeds to growers, faster.
  • The program is currently focused on corn, but it can be expanded to other crops.


Consider your smartphone. It places more computing power at your fingertips than people 20 years ago could imagine, and it’s right there in your pocket. The first computers were the size of entire rooms, immensely expensive, and required specialized training to operate. Computer technology wasn’t widely distributed, but thanks to the invention of the microchip and other technological improvements, smartphones are commonplace. The smartphone is amazing because of what it can do, but also because it’s right there in your pocket.

Tim Kelliher suspects HI-Edit™ technology will revolutionize seed production in a similar way.

“HI-Edit is basically a faster way to bring biotech to farmers,” says Kelliher, Ph.D., head of technology development and science fellow with Syngenta Seeds and one of the inventors of the HI-Edit technique. “It allows us to make genetic changes to commercial varieties without a lot of lab and greenhouse costs and time.”

How HI-Edit Helps

HI-Edit, or Haploid Induction EDITing, introduces genetic changes in crop varieties quickly. This new biotechnology cuts the genome-editing process down to one step by installing CRISPR, a protein enzyme that allows researchers to precisely alter DNA sequences and modify gene function, in a haploid induction line. Researchers then cross the HI-Edit line to commercial crop varieties, and the CRISPR makes a precise modification in the DNA sequence of those varieties. Because it’s in a haploid inducer line, the CRISPR enzyme and the haploid inducer DNA are eliminated from the resulting seed, which contains only the original crop variety’s genetic material with the modified genetic sequence.

Rather than inserting CRISPR to edit all commercial varieties or making edits and breeding them into commercial varieties, a CRISPR insertion to a HI-Edit line need only be made once. The researchers then use that line to fertilize plants from the commercial varieties. The resulting embryos inside the seeds match the original commercial varieties except for the desired trait. This process removes the need for generations of selection and backcrossing or making individual CRISPR edits to many commercial varieties, saving vast amounts of time and resources.

“Where HI-Edit comes in is when we want to make specific changes to a bunch of different varieties,” Kelliher says. “If we tried to use CRISPR on all commercial varieties it would take too much time, money, technology and expertise. So instead of making the edit in a donor line and crossing it in, we make it in the haploid inducer line, cross it once and put the edit directly into those commercial varieties.”

''

HI-Edit is basically a faster way to bring biotech to farmers. It allows us to make genetic changes to commercial varieties without a lot of lab and greenhouse costs and time.

Tim Kelliher, Ph.D. Head of Technology Development and Science Fellow Syngenta Seeds

HI-Edit cuts down the time of introducing new traits by years and at a much lower cost. It will potentially offer growers quicker access to commercial seed varieties with traits like better protein, drought tolerance, disease resistance and more. The goal is to deliver better seeds to growers, faster, through innovation.

“This is good news because growers are going to get the latest and greatest traits by a simple change in the genetic sequence years sooner than they would otherwise,” Kelliher says.

Genome Editing vs. GMOs

Genetically modified organisms (GMOs), according to traditional thinking, are organisms that have had a foreign piece of DNA, a piece that’s totally different from what’s in the natural organism, inserted into them. A well-known example is Bt11 corn, which uses a gene from Bacillus thuringiensis (Bt), a common soil bacterium that produces several insecticidal proteins.

The Bt gene is responsible for producing a protein toxic to European corn borer. The Bt11 corn, now producing this protein, kills European corn borer larvae when they feed on the plant. This sort of modification, the insertion of a completely foreign bacterium gene into the corn genome, is a traditional GMO.

alt Slide Image

Genome editing, on the other hand, is when scientists make slight alterations to a genetic sequence already within the organism. The HI-Edit process falls under the genome editing category, rather than GMO.

The U.S. Department of Agriculture (USDA) issued regulatory guidance on genome editing that establishes exemptions for plants modified by genetic engineering where the modification could otherwise have been made through conventional breeding. At this time, regulatory guidance on HI-Edit will depend on the type and size of the edits. This guidance is currently evolving as the USDA’s Animal and Plant Health Inspection Service (APHIS) replaces the current review process. Under the new process, developers voluntarily submit information on genetically modified plants to APHIS, which then determines if the modified plant requires USDA approval.

Exportation of genome-edited products is also influenced by the fact that regulations vary from country to country.

“If we are to foster an environment that supports continued innovation and maintains the U.S.’ leadership role at the global level, we must ensure that USDA works closely with the Food and Drug Administration and the Environmental Protection Agency to ensure consistent, science-and risk-based policies across the U.S. government, while continuing to take a leadership role in working towards alignment at the international level,” says Mary Kay Thatcher, senior manager, federal government and industry relations at Syngenta.

The HI-Edit process is currently focused on corn but can be used on other crops like rice and wheat. Syngenta hopes to expand the process for use on other crops. The anticipated release date for gene-edited seeds using this process is still a few years away, but Syngenta sees the promise a biotechnology like this has for helping farmers get the most from their land. Kelliher says he is hopeful that in the not-too-distant future, this exciting biotechnology will deliver the latest and greatest seed traits to farmers on a larger scale than ever before.

Kelliher believes new technology is wonderful. Distributing it widely to those it benefits is even better.

PLANT BREEDING 101

In the context of plant breeding, a trait is a characteristic exhibited by a plant. It could be something like drought tolerance, stalk strength, resistance to a specific disease, or increased yield. The ag science community constantly researches which genetic sequences impact traits that bring value to farmers. Scientists usually learn about the genetic sequence responsible for a desirable trait while studying one specific variety. The challenge becomes how to transfer that desirable trait into many varieties.

Traditionally, the variety with a desirable trait is bred with other varieties in which scientists also want it to appear. Plant breeders carefully select and backcross the offspring of those varieties that exhibit that trait and then repeat that process with each generation until eventually a stable variety with the trait emerges. That process typically takes six or seven plant generations, requiring a significant investment over several years.

MOST POPULAR ARTICLES

Active Ingredient Spotlight: ADEPIDYN Technology

Advancing Regenerative Agriculture

Stay Healthy Inside and Out: Wellness Tips for Farmers

Protect Groves From Citrus Leafminer: Where to Start

Navigating Volatile Markets With Confidence

Syngenta currently invests about $1.5 billion in research and development each year. If Syngenta discovered a genetic sequence that improved drought tolerance and decided to add that trait into the many existing varieties optimized for specific geographies, the traditional process would require breeding and backcrossing each existing commercial variety.

HI-Edit, however, makes it possible to move those lines more efficiently. The HI-Edit process leans into the basics of sexual reproduction:

When a sperm with its male chromosomes fertilizes an egg with its female chromosomes, together they form a zygote, which contains chromosomes from each parent. The sperm or the egg is a haploid, containing only a single set of chromosomes. The zygote is a diploid, containing a complete set of chromosomes from each parent.

But some plants are haploid inducers. Haploid inducers cause female plants to produce seeds containing embryos that include only one parent’s genetic material, or a haploid embryo.

That’s where HI-Edit goes to work.

Cautionary Statement Regarding Forward-Looking Statements

This document contains forward-looking statements, which can be identified by terminology such as ‘expect’, ‘would’, ‘will’, ‘potential’, ‘plans’, ‘prospects’, ‘estimated’, ‘aiming’, ‘on track’ and similar expressions. Such statements may be subject to risks and uncertainties that could cause the actual results to differ materially from these statements. For Syngenta, such risks and uncertainties include risks relating to legal proceedings, regulatory approvals, new product development, increasing competition, customer credit risk, general economic and market conditions, compliance and remediation, intellectual property rights, implementation of organizational changes, impairment of intangible assets, consumer perceptions of genetically modified crops and organisms or crop protection chemicals, climatic variations, fluctuations in exchange rates and/or commodity prices, single source supply arrangements, political uncertainty, natural disasters, and breaches of data security or other disruptions of information technology. Syngenta assumes no obligation to update forward-looking statements to reflect actual results, changed assumptions or other factors.

© 2022 Syngenta. HI-EditTM and the Syngenta Logo is a trademark of a Syngenta Group Company. All other trademarks are the property of their respective owners.

  • « Go to Previous Page
  • Go to page 1
  • Interim pages omitted …
  • Go to page 15
  • Go to page 16
  • Go to page 17
  • Go to page 18
  • Go to page 19
  • Interim pages omitted …
  • Go to page 30
  • Go to Next Page »

Primary Sidebar

The ag stories you want, straight to your inbox

The ag stories you want, straight to your inbox

Subscribe for free, monthly emails


    Thank you for subscribing to Thrive! You’re on your way to getting the latest ag insights in your inbox each month.

    connect with us:

    All photos and videos are either property of Syngenta or are used with permission. Syngenta hereby disclaims any liability for third-party websites referenced herein. Product performance assumes disease presence. Performance assessments are based upon results or analysis of public information, field observations and/or internal Syngenta evaluations. Trials reflect treatment rates commonly recommended in the marketplace.

    © 2025 Syngenta. Important: Always read and follow label instructions. Some products may not be registered for sale or use in all states or counties. Please check with your local extension service to ensure registration status. AAtrex 4L, AAtrex Nine-O, Acuron, Agri-Flex, Agri-Mek 0.15 EC, Agri-Mek SC, Avicta 500FS, Avicta Complete Beans 500, Avicta Complete Corn 250, Avicta Duo 250 Corn, Avicta Duo Corn, Avicta Duo COT202, Avicta Duo Cotton, Besiege, Bicep II Magnum, Bicep II Magnum FC, Bicep Lite II Magnum, Callisto Xtra, Denim, Endigo ZC, Endigo ZCX, Epi-Mek 0.15EC, Expert, Force, Force 3G, Force CS, Force 6.5G, Force Evo, Gramoxone SL 2.0, Gramoxone SL 3.0, Karate, Karate with Zeon Technology, Lamcap, Lamcap II, Lamdec, Lexar EZ, Lumax EZ, Medal II ATZ, Minecto Pro, Proclaim, Tavium Plus VaporGrip Technology, Voliam Xpress and Warrior II with Zeon Technology are Restricted Use Pesticides.

    Some seed treatment offers are separately registered products applied to the seed as a combined slurry. Always read individual product labels and treater instructions before combining and applying component products. Orondis Gold may be sold as a formulated premix or as a combination of separately registered products: Orondis Gold 200 and Orondis Gold B.

    Important: Always read and follow label and bag tag instructions; only those labeled as tolerant to glufosinate may be sprayed with glufosinate ammonium-based herbicides. Under federal and local laws, only dicamba-containing herbicides registered for use on dicamba-tolerant varieties may be applied. See product labels for details and tank mix partners.

    VaporGrip® is a registered trademark of Bayer Group, used under license. All other trademarks are the property of their respective owners.

    Please note that by providing your e-mail address you are agreeing to receive e-mail communications from Syngenta. Addresses will be used in accordance with the Syngenta privacy policy.

    • © 2025 Syngenta
    • User Agreement
    • Online Privacy Policy
    • Cookie Policy
    • SMS Terms and Conditions
    • Do Not Sell Or Share My Personal Information