Global Grain Stocks Tighten Further
With tighter commodity stocks, more production acres are required to meet demand.

It’s easy to get caught up in the latest World Agricultural Supply and Demand Estimates — and subsequent market response — but looking at the bigger picture is often more valuable. Many have noted that ending stocks are tight for several commodities. However, let’s look at just how tight conditions are across all commodities, and how that stacks up with historical observations.
The Data
Our team, the AEI team, has a unique way of considering the ending stock situation across all 13 primary crops. To measure overall abundance or tightness, we convert the quantity of ending stocks (i.e., bushels) for each crop to acres worth of production. For example, instead of thinking about U.S. corn stocks as 1.388 billion bushels worth, we use a measure of yield to calculate acres worth of ending stocks. This acre-equivalent measure has the benefit of being consistent across all commodities and, subsequently, ending stocks can be added together.
This broad measure provides insights such as how easily a tight corn situation might be resolved. If global stocks are abundant in other crops, such as soybean or wheat, acreage could be shifted to increase corn production. However, if ending stocks are tight across all crops, substituting soybean for corn isn’t as feasible. This is to say that new acres can sometimes be hard to steal from other crops and, in extreme circumstances, may require new acreage to come into production.
The U.S. Situation
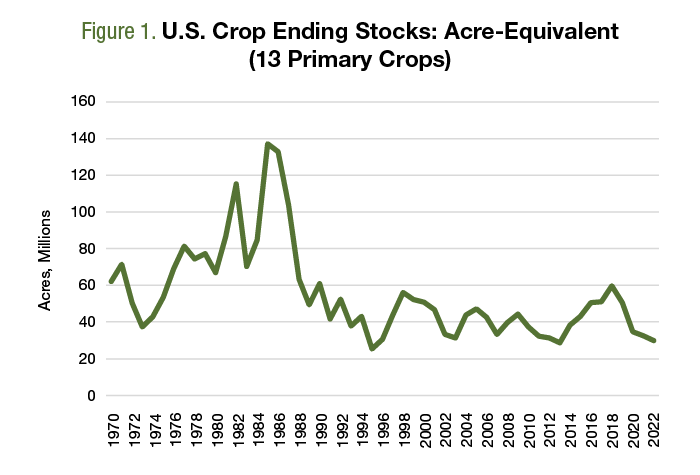
Figure 1 shows the acre-equivalence of ending stocks across 13 crops. For 2021, ending stocks were tight, at nearly 33 million acres worth. For 2022, the situation is even tighter as current projections put ending stocks at nearly 30 million acres worth. For context, stocks reached nearly 60 million acres as the trade war got underway in 2018. Ending stocks across all crops harvested in 2022 are projected at half the levels seen just four years ago.
Historically, acre-equivalent ending stocks were as low as 28.7 million acres in 2013 and 25.4 million acres in 1995. While a bit off the record lows, the current U.S. stock situation is among the tightest observed since the 1970s, and conditions have spanned both extremes in a short period of time.

The World Situation
This method of measuring stocks also allows us to capture how tight — or abundant — grain inventories are at the global level. There are two challenges, however. First, China accounts for a large share of global grain inventories. To account for this, we can remove China’s quantity of ending stocks from the global total. The logic here is that China is a net importer of grains, so these bushels are unlikely to be exported. These adjusted data provide a measure of how much is available for global trade.
How big of a deal is this? In 2022, China accounted for roughly half of the acre-equivalent global ending stocks.
The second issue is that the global factory has expanded over time, and the 300 million acre-equivalence of ending stocks in 2022 is less burdensome today than it was 10 to 20 years ago.
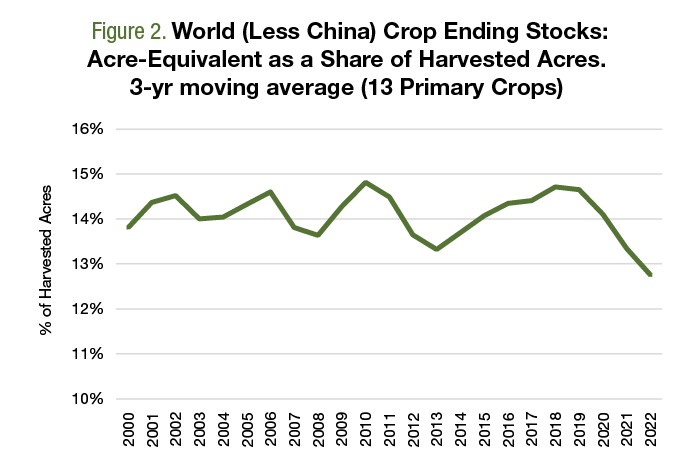
Figure 2 reports global ending stocks, less China’s inventory, as an acre-equivalent share of harvested acres. This measure reports ending stocks available for trade relative to the size of the global acreage factory.
In 2022, global ending stocks are equivalent to 12.8% of global production, down from 13.3% in 2021 and a high of 14.7% in 2018. This measure of stocks shows conditions are considerably tighter than the 2013 lows (13.3%). Given all the factors, ending stocks across the board are arguably the tightest in two decades.

Wrapping It Up
The grain end-stock situation trended tighter in recent years. While conditions in 2021 were tight, it seems they will be even tighter after the books are closed on 2022.
There are two key reasons monitoring these data is important. First, it provides us with background on how nervous markets will be about supply-related issues, such as weather, conflict or economic sanctions. Given the overall tight global situation, any hiccup could have significant implications.
Second, each commodity has its own story and degree of uncertainty, but the big picture consideration is that conditions across the board are tight. The implications are that any supply shocks won’t easily be solved with substitution acres. Instead, growers would need to bring new crop acres into production around the world to make up a shortfall.
Concerns about tight stocks will likely continue into 2023. The combination of usage, acreage and yields will ultimately determine when ending stocks turn higher, but we expect this to take place at some point.
Widmar and Gloy are the co-founders of Ag Economic Insights (AEI.ag). Founded in 2014, AEI.ag helps improve decision making for producers, lenders, and agribusiness through: the free Weekly Insights blog, the award-winning AEI.ag Presents podcast- featuring Escaping 1980 and Corn Saves America, and the AEI Premium platform, which includes the Ag Forecast Network decision tool. Visit AEI.ag or email Widmar (david@aei.ag) to learn more. Stay curious.
4 Min Read
- Global commodity stocks are arguably the tightest in 20 years.
- Any supply-related hiccup could have global complications.
- The global tightening may be a call for new production acres.


