Variable Cropland Values Impact Farm Outlook
Certain crops and regions have benefited more from increased farmland valuation.

It’s no secret that farmland values have been on a tear in recent years. Fueled by low interest rates and strong farm profitability, the most frequent question has been, “how much higher?” With many data sources and variations across states and regions, it’s helpful to step back and consider the trends.
The graph below shows the value of U.S. cropland since 2000. Over the 22-year period, values increased from $1,460 to $5,050 per acre. This is equal to an average annual rate of increase of 5.5%.
Over the last year, these values jumped 14.3%. That kind of jump happens periodically when you look across the last 22 years.
Historically, cropland has experienced short periods of big gains, followed by years of smaller changes. This is to say, the average annual gains of 5.5% are rarely observed. Large gains in valuations were posted in 2004 — when values increased by more than 17% — and again between 2011 and 2013 when double-digit annual increases were sustained. Since 2000, values increased by more than 10% annually on seven occasions — or 32% of the time. On the other hand, land values increased by less than 5% annually twelve times — or 55% of observations.
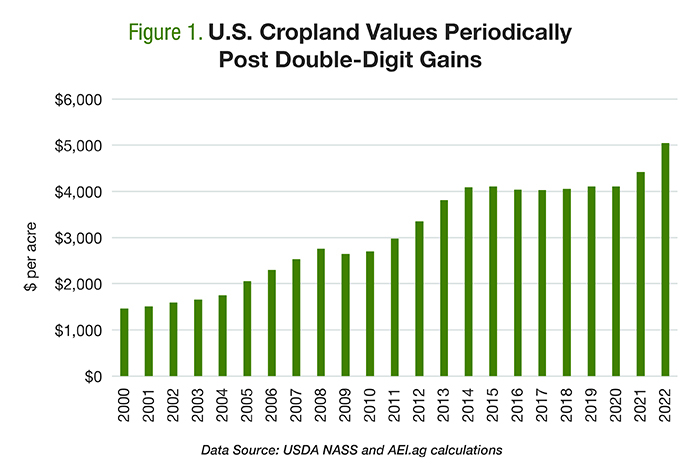
The average doesn’t tell the story well. U.S. cropland values jumped by double-digits seven times between 2000 and 2022, according to a U.S. Department of Agriculture report released in August. The average gain over that span is 5.5%.
Big Variations Since 2010
The second graph shows the change in cropland values at the state level since 2010. First, keep in mind that a 100% increase means values doubled. Six states — those in the northern Great Plains and western Corn Belt — saw cropland values more than double. The largest gains occurred in North Dakota, up 180%. While one would expect considerable difference with county-level data, the average value of cropland in North Dakota increased from $840 per acre in 2010 to $2,350 in 2022. Large gains in cropland values were also observed throughout the Corn Belt, southern Plains and Delta region. It should be noted, however, that the “farmland boom” story varies across the United States. For example, cropland values in the Southwest, specifically Arizona and New Mexico, increased by less than 10% in total across the two decades. In these states, the total increase is what some states observed on an average, annualized basis.
Similarly, land values in the Southeast also were slow to increase. Why have farmland values increased so slowly in some regions? At a high level, it’s because farm economy expansion hasn’t impacted each commodity or region in the same way. In general, regions that were able to increase the production of profitable commodities, such as corn and soybeans, saw the largest gains in farmland values. A second consideration is regional challenges, such as water availability in the Southwest.
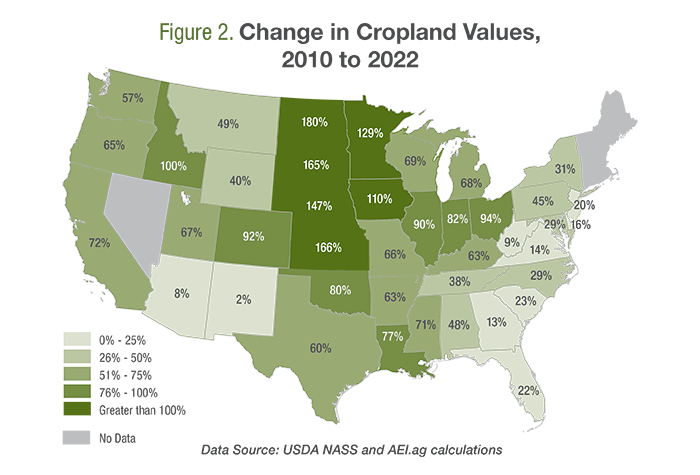
State-level changes in cropland values between 2010 to 2022 show values more than doubled in six states in the northern Great Plains and western Corn Belt. Across the country, the largest gains are in regions that were able to increase the production of profitable commodities, such as corn and soybeans.
Wrapping it Up
For many, the farmland boom since late 2020 builds on the gains of the last two decades. National-level data show that farmland posted small, modest increases in most years. However, there are a handful of years when large annual increases — greater than 10% — occur. The most recent data reveal the changes since 2021 are among those large gains.
Second, conditions vary significantly by region and state. Gains in the northern Great Plains were huge, while changes in the Southeast and Southwest were considerably less. Producers need to keep this in mind when sizing up how much local conditions have changed.
Lastly, news of higher farmland values is often met with excitement. This is because farmland accounts for a majority — around 80% — of the farm sector assets. In other words, a majority of farm assets are farmland. Additionally, farmland values tend to increase during times of strong profitability. However, it’s worth keeping in mind that higher farmland values are also reflective of higher costs of production through higher cash rents paid. It can also mean higher debt service obligations and lower rates of return for those looking to purchase new acreage.
While the farmland story has been largely positive in recent memory, the outlook will be dominated by uncertainty around rising costs of production, future commodity prices, and interest rates. At this point, a wide range of outcomes seems possible.
David and Brent are the co-founders of Ag Economic Insights (AEI.ag). Founded in 2014, AEI.ag helps improve producers, lenders, and agribusiness decision-making through 1) the free Weekly Insights blog, 2) the award-winning AEI.ag Presents podcast – featuring Escaping 1980 and Corn Saves America, and 3) the AEI Premium platform, which includes the Ag Forecast Network decision tool. Visit AEI.ag or email David (david@aei.ag) to learn more. Stay curious.

4 Min Read
- U.S. farmland values increased 14.3% last year.
- The farmland boom varies across the U.S.
- Higher farmland values can mean higher production costs.


More Articles About Farm Operations


RECOMMENDED FOR YOU